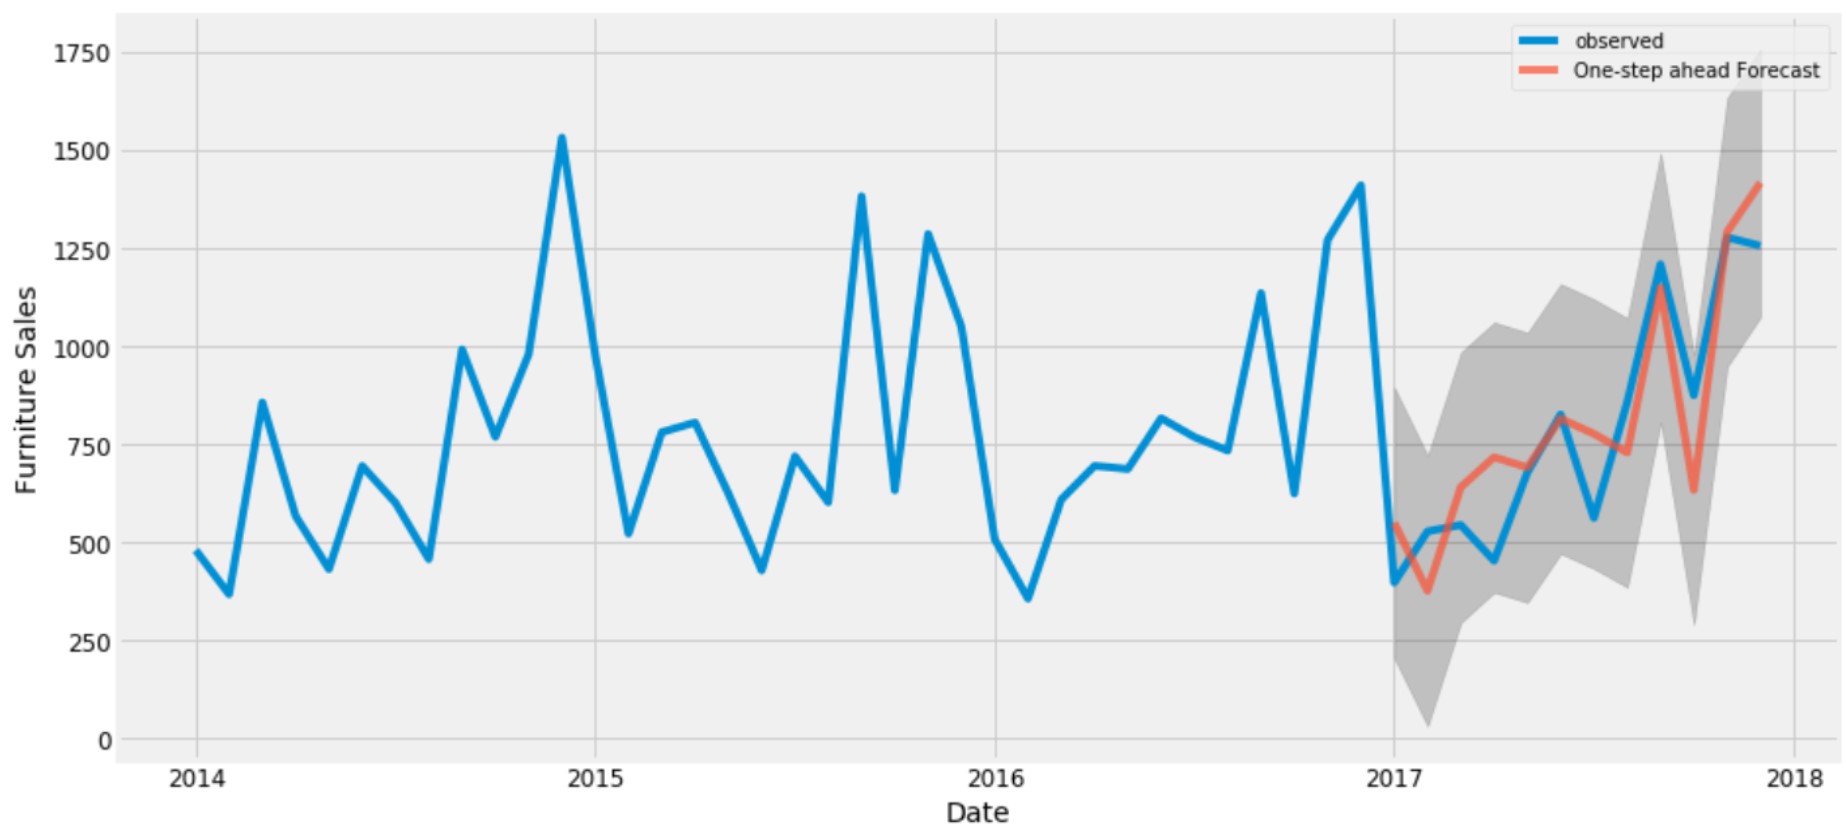
Time series analysis
Time series analysis is a specialized field in machine learning and statistics that deals with data points collected or recorded over time.
These data points are typically ordered chronologically, and the goal of time series analysis is to uncover patterns, trends, and dependencies within the data.
Time series data is prevalent in various domains, including finance, economics, climate science, healthcare, and more.
Some fundamental concepts and techniques related to time series analysis in machine learning:
-
Time Series Data: Time series data consists of a sequence of observations or measurements taken at regular intervals. These observations are recorded over time, making the order of data points crucial for analysis.
-
Components of Time Series:
- Trend: A trend represents the long-term movement or direction in the time series data. It can be upward (increasing), downward (decreasing), or flat (stationary).
- Seasonality: Seasonality refers to periodic patterns or fluctuations that occur at regular intervals, such as daily, weekly, or annually. These patterns often result from recurring events or external factors.
- Noise (Irregular Component): Noise represents the random or irregular variations in the data that are not attributed to trends or seasonality. It introduces randomness and uncertainty into the time series.
-
Time Series Decomposition: Decomposing a time series involves separating it into its constituent components, such as trend, seasonality, and noise. This decomposition helps in understanding the underlying patterns and making forecasts.
-
Time Series Forecasting: Time series forecasting is the process of predicting future values or trends based on historical data. Various forecasting methods, including ARIMA (AutoRegressive Integrated Moving Average), Exponential Smoothing, and machine learning techniques like recurrent neural networks (RNNs) and Long Short-Term Memory (LSTM) networks, are used for this purpose.
-
Autocorrelation: Autocorrelation measures the relationship between a data point and past data points in the same time series. It is a crucial concept for understanding dependencies within the time series and selecting appropriate forecasting models.
-
Stationarity: Stationarity is a property of time series data where statistical properties, such as mean and variance, remain constant over time. Stationary time series are easier to model and forecast. Techniques like differencing can be used to make a non-stationary series stationary.
-
Resampling and Interpolation: Resampling involves changing the frequency of time series data, such as converting daily data to monthly data or vice versa. Interpolation methods can be used to fill in missing data points.
-
Feature Engineering: Feature engineering involves selecting and creating relevant features from the time series data to improve machine learning model performance. Features may include lagged values, moving averages, or statistical measures.
-
Evaluation Metrics: Various evaluation metrics, such as Mean Absolute Error (MAE), Mean Squared Error (MSE), and Root Mean Squared Error (RMSE), are used to assess the accuracy of time series forecasts.
-
Cross-Validation: Cross-validation techniques, such as time series cross-validation or walk-forward validation, are used to evaluate how well a forecasting model generalizes to unseen data.
Time series analysis and forecasting play a crucial role in making informed decisions in industries like finance for stock price prediction, in weather forecasting, demand forecasting in supply chain management, and many other applications where historical data patterns are valuable for predicting future trends and outcomes.
