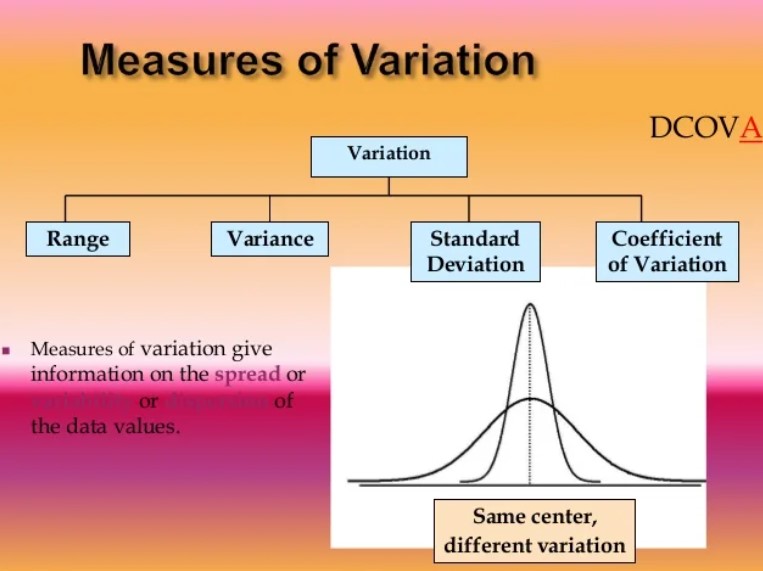
Variation
Suppose we have a dataset that represents the daily sales (in dollars) of a retail store for a particular week.
The sales data for the seven days are as follows:
100, 150, 120, 130, 140, 110, 160. We can calculate various measures of variation for this dataset: Range: The range is calculated as the difference between the maximum and minimum values.
In this case, the maximum value is 160 and the minimum value is 100, so the range is 160 - 100 = 60. Variance: To calculate the variance, we first need to find the mean of the dataset. Adding up all the values and dividing by the number of data points, we get: (100 + 150 + 120 + 130 + 140 + 110 + 160) / 7 = 120.
The variance is then calculated as the average of the squared differences from the mean. For example, the squared difference for the first data point (100) is (100 - 120)^2 = 400. Doing this calculation for all data points and taking the average, we get the variance as follows: Variance = [(100 - 120)^2 + (150 - 120)^2 + (120 - 120)^2 + (130 - 120)^2 + (140 - 120)^2 + (110 - 120)^2 + (160 - 120)^2] / 7 = 400 + 900 + 0 + 100 + 400 + 100 + 1600 / 7 = 400.
Standard Deviation
The standard deviation is the square root of the variance. Taking the square root of the calculated variance, we find that the standard deviation is √400 = 20.
Interquartile Range (IQR)
To calculate the IQR, we first need to find the first quartile (Q1) and the third quartile (Q3). The dataset, when arranged in ascending order, becomes: 100, 110, 120, 130, 140, 150, 160.
The first quartile (Q1) is the median of the lower half of the data, which is 110 in this case. The third quartile (Q3) is the median of the upper half of the data, which is 150.
The IQR is then calculated as Q3 - Q1 = 150 - 110 = 40. These measures of variation provide different insights into the spread of the sales data. The range indicates that the sales vary by $60 throughout the week.
The variance and standard deviation provide a measure of the average deviation of sales from the mean, which is $120.
The IQR provides a measure of the spread within the central 50% of the data, which is $40. By analyzing variation in the sales data, we can assess the consistency or variability in daily sales, identify potential outliers, and make decisions based on the spread of the data.
