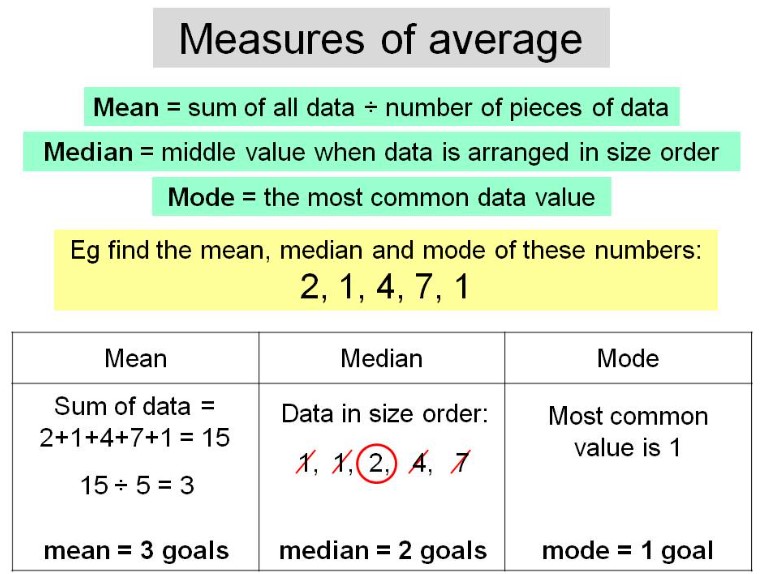
Mean Median Mode
Consider the following dataset of test scores: 78, 85, 92, 85, 90, 78, 88, 82, 92, 85.
Mean
To calculate the mean, we add up all the values in the dataset and divide the sum by the total number of values. Mean = (78 + 85 + 92 + 85 + 90 + 78 + 88 + 82 + 92 + 85) / 10 = 860 / 10 = 86 The mean of the dataset is 86.
Median
To find the median, we arrange the dataset in ascending or descending order and determine the middle value. Arranging the dataset in ascending order: 78, 78, 82, 85, 85, 85, 88, 90, 92, 92. Since the dataset has 10 values, the median is the average of the two middle values: (85 + 85) / 2 = 170 / 2 = 85. The median of the dataset is 85.
Mode
The mode is the value(s) that appear most frequently in the dataset. In the given dataset, the value 85 appears three times, which is more frequent than any other value. Hence, the mode of the dataset is 85.
So, in this example: Mean = 86 Median = 85 Mode = 85 These measures provide different perspectives on the central tendency of the dataset.
The mean indicates the average score, the median represents the middle score, and the mode identifies the most frequently occurring score.

Enroll Now
- Python Programming
- Machine Learning